Functions
Warmup activity
Work on the activity (handout) with a neighbor, then we will discuss as a class
Warmup
What does this code do?
Warmup
The diamonds dataset has 53940 rows and 10 columns. What will be the dimensions of the diamonds_new dataset?
Warmup
z_score <- function(x) {
  (x - mean(x, na.rm = TRUE)) / sd(x, na.rm = TRUE)
}

diamonds_new <- diamonds |>
  mutate(carat_z = z_score(carat))
glimpse(diamonds_new)Rows: 53,940
Columns: 11
$ carat <dbl> 0.23, 0.21, 0.23, 0.29, 0.31, 0.24, 0.24, 0.26, 0.22, 0.23, 0.…
$ cut <ord> Ideal, Premium, Good, Premium, Good, Very Good, Very Good, Ver…
$ color <ord> E, E, E, I, J, J, I, H, E, H, J, J, F, J, E, E, I, J, J, J, I,…
$ clarity <ord> SI2, SI1, VS1, VS2, SI2, VVS2, VVS1, SI1, VS2, VS1, SI1, VS1, …
$ depth <dbl> 61.5, 59.8, 56.9, 62.4, 63.3, 62.8, 62.3, 61.9, 65.1, 59.4, 64…
$ table <dbl> 55, 61, 65, 58, 58, 57, 57, 55, 61, 61, 55, 56, 61, 54, 62, 58…
$ price <int> 326, 326, 327, 334, 335, 336, 336, 337, 337, 338, 339, 340, 34…
$ x <dbl> 3.95, 3.89, 4.05, 4.20, 4.34, 3.94, 3.95, 4.07, 3.87, 4.00, 4.…
$ y <dbl> 3.98, 3.84, 4.07, 4.23, 4.35, 3.96, 3.98, 4.11, 3.78, 4.05, 4.…
$ z <dbl> 2.43, 2.31, 2.31, 2.63, 2.75, 2.48, 2.47, 2.53, 2.49, 2.39, 2.…
$ carat_z <dbl> -1.198157, -1.240350, -1.198157, -1.071577, -1.029384, -1.1770…Functions
Functions
R for Data Science calls the z_score function a “mutate” function. Why?
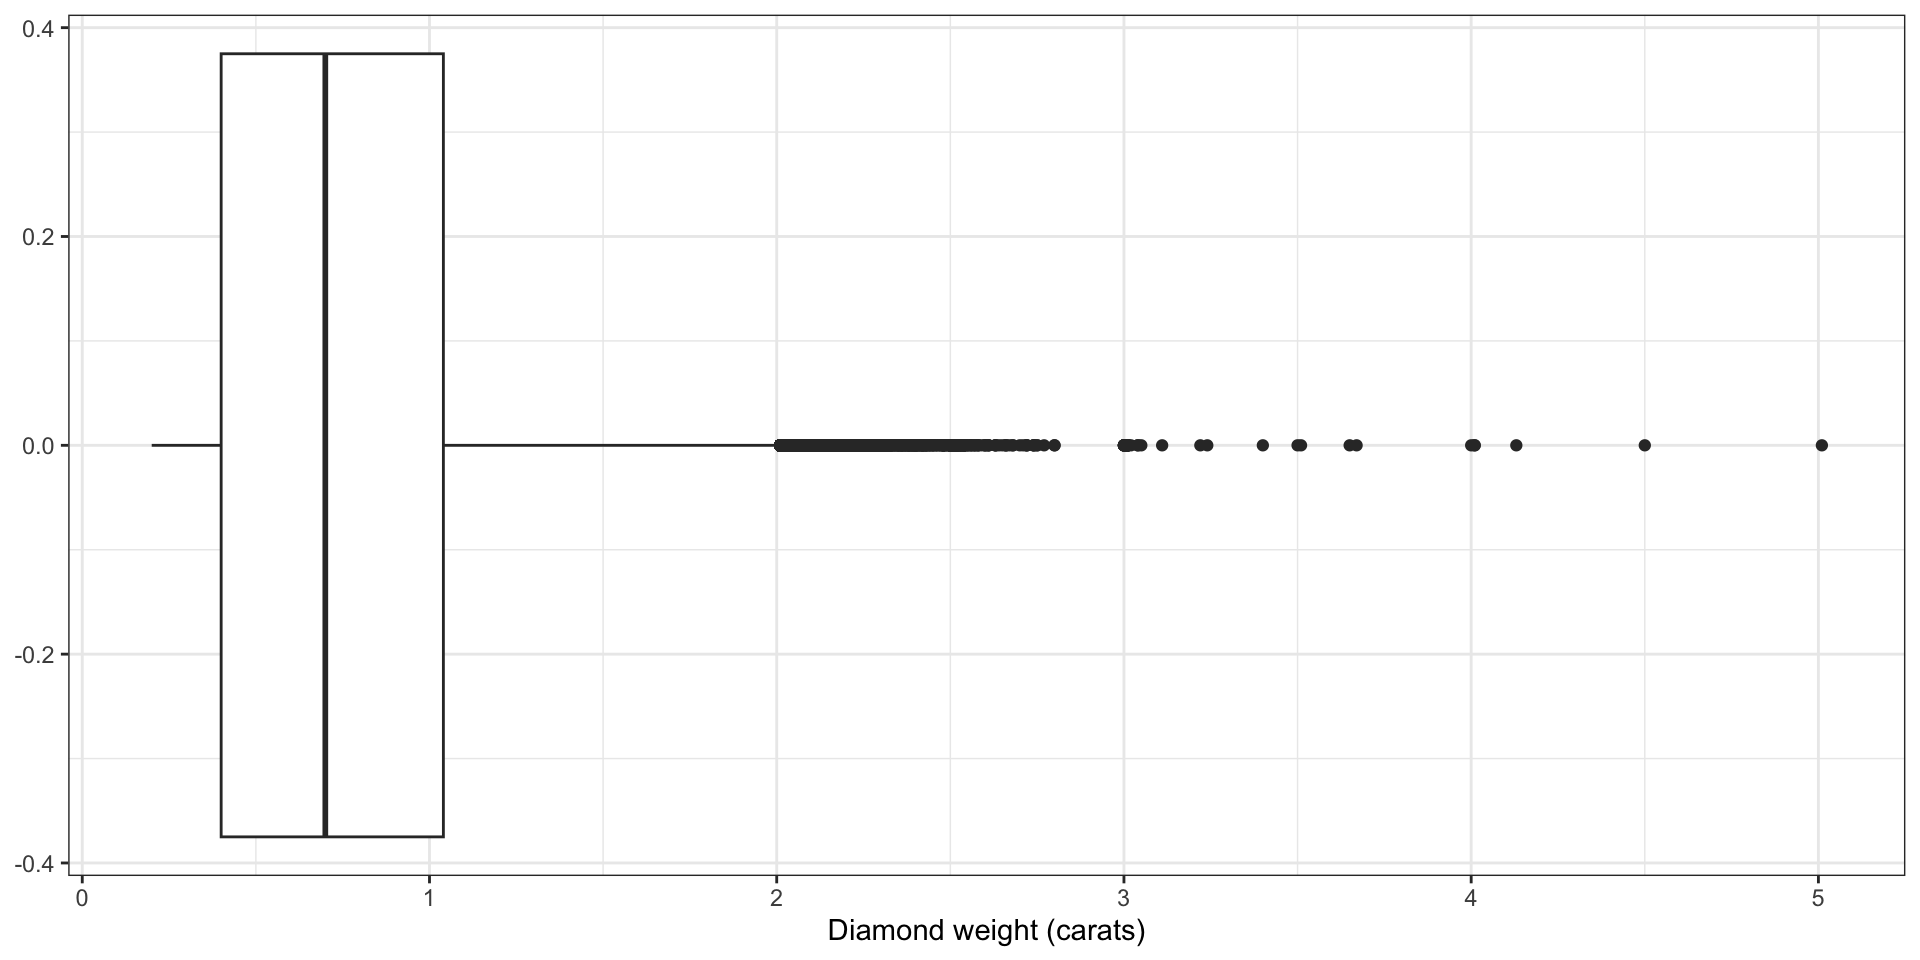
Another challenge

What are the individual points on the right of the boxplot?
Another challenge: identifying outliers

How do we identify outliers when constructing a boxplot?
Identifying outliers
We wish to write a function that we can use to identify outliers in numeric variables.
What should we name the function?
Identifying outliers
We wish to write a function that we can use to identify outliers in numeric variables.
What should the input to the function be?
Identifying outliers
What needs to happen inside the function?
Identifying outliers
(Switch to R Studio)
Identifying outliers
Counting outliers
What if we want to count the number of outliers?
Counting outliers
Counting outliers
# A tibble: 1 × 1
  carat_outliers
           <int>
1           1889
R for Data Science would call the count_outliers function a “summarize” function. Why?
Counting outliers
# A tibble: 1 × 1
  carat_outliers
           <int>
1           1889
What if I want to count outliers for multiple variables?
Counting outliers
Class activity
https://sta279-f25.github.io/class_activities/ca_09.html
- Work with a neighbor on the class activity
- At the end of class, submit your work as an HTML file on Canvas (one per group, list all your names)
For next time, read:
- Chapter 25.3 in R for Data Science